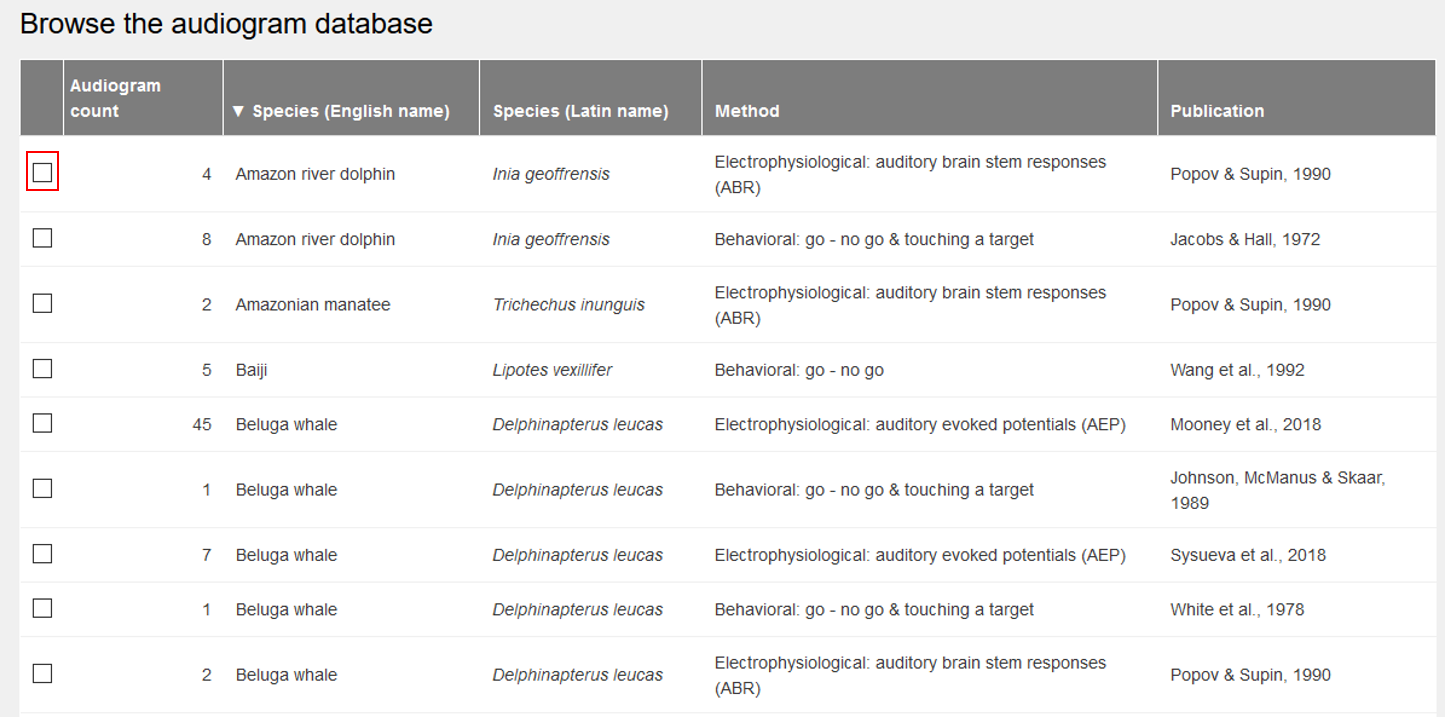
Browse
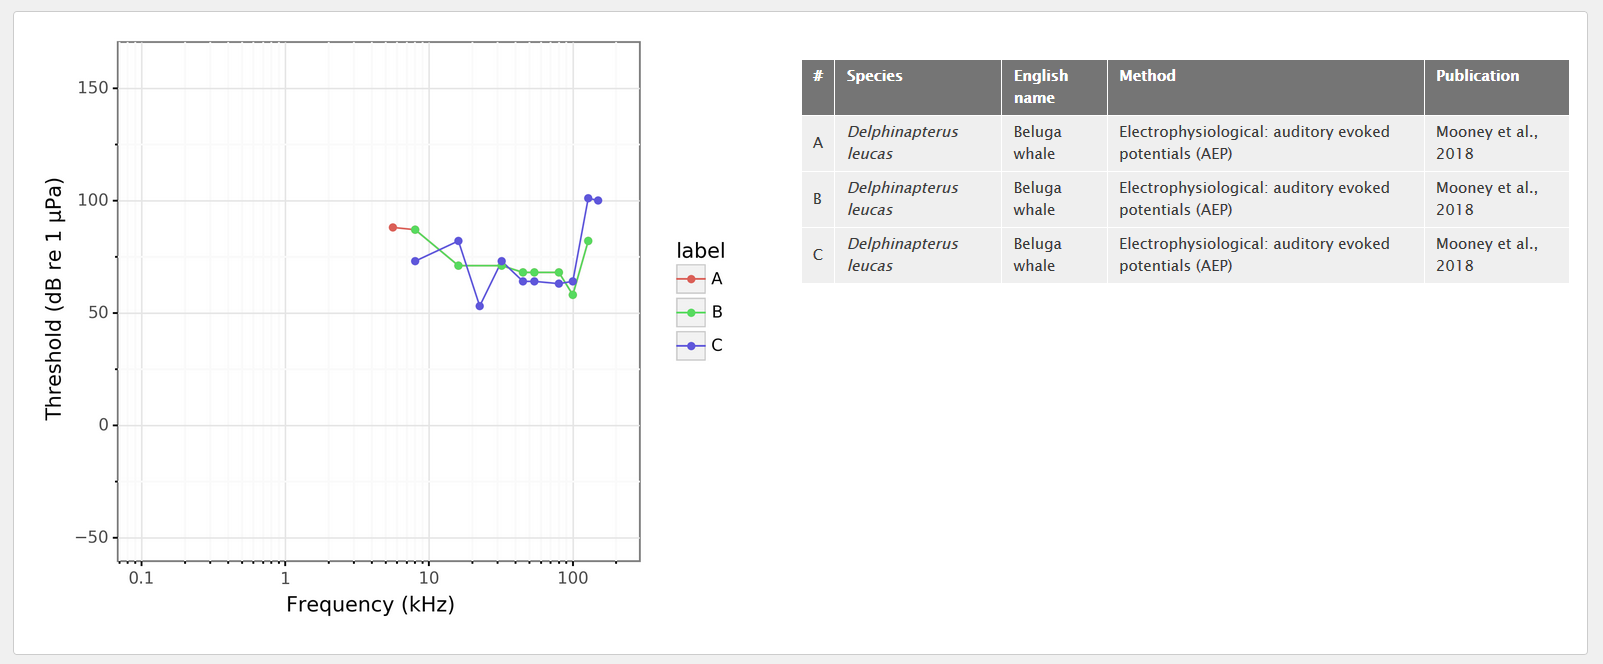
The Browse function can be used to select audiograms and mark them for detailed display. Each row reflects all audiograms from one publication that were generated for the same species using the same method. The table may show several audiograms for a given source. If a source contains data on different individual animals or species, this data is represented in separate audiograms at the highest possible level of resolution. An audiogram represents data from measurements of a single individual or of several individuals for which averaged data had been reported.
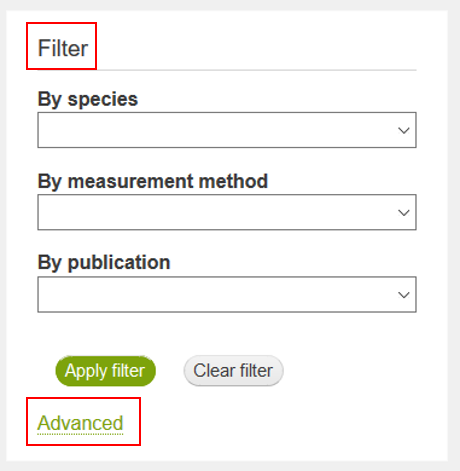
Filter
Audiograms can be filtered according to various criteria such as species, method or publication. The Select function allows several audiograms to be displayed in a coherent manner. The advanced filter function can be used to filter for detailes information. It should be noted that not all atributes, such as the year of the experiment, were included in the publications compiled here, so that the use of certain filters can filter out some audiograms.
Detailed View and Overlays
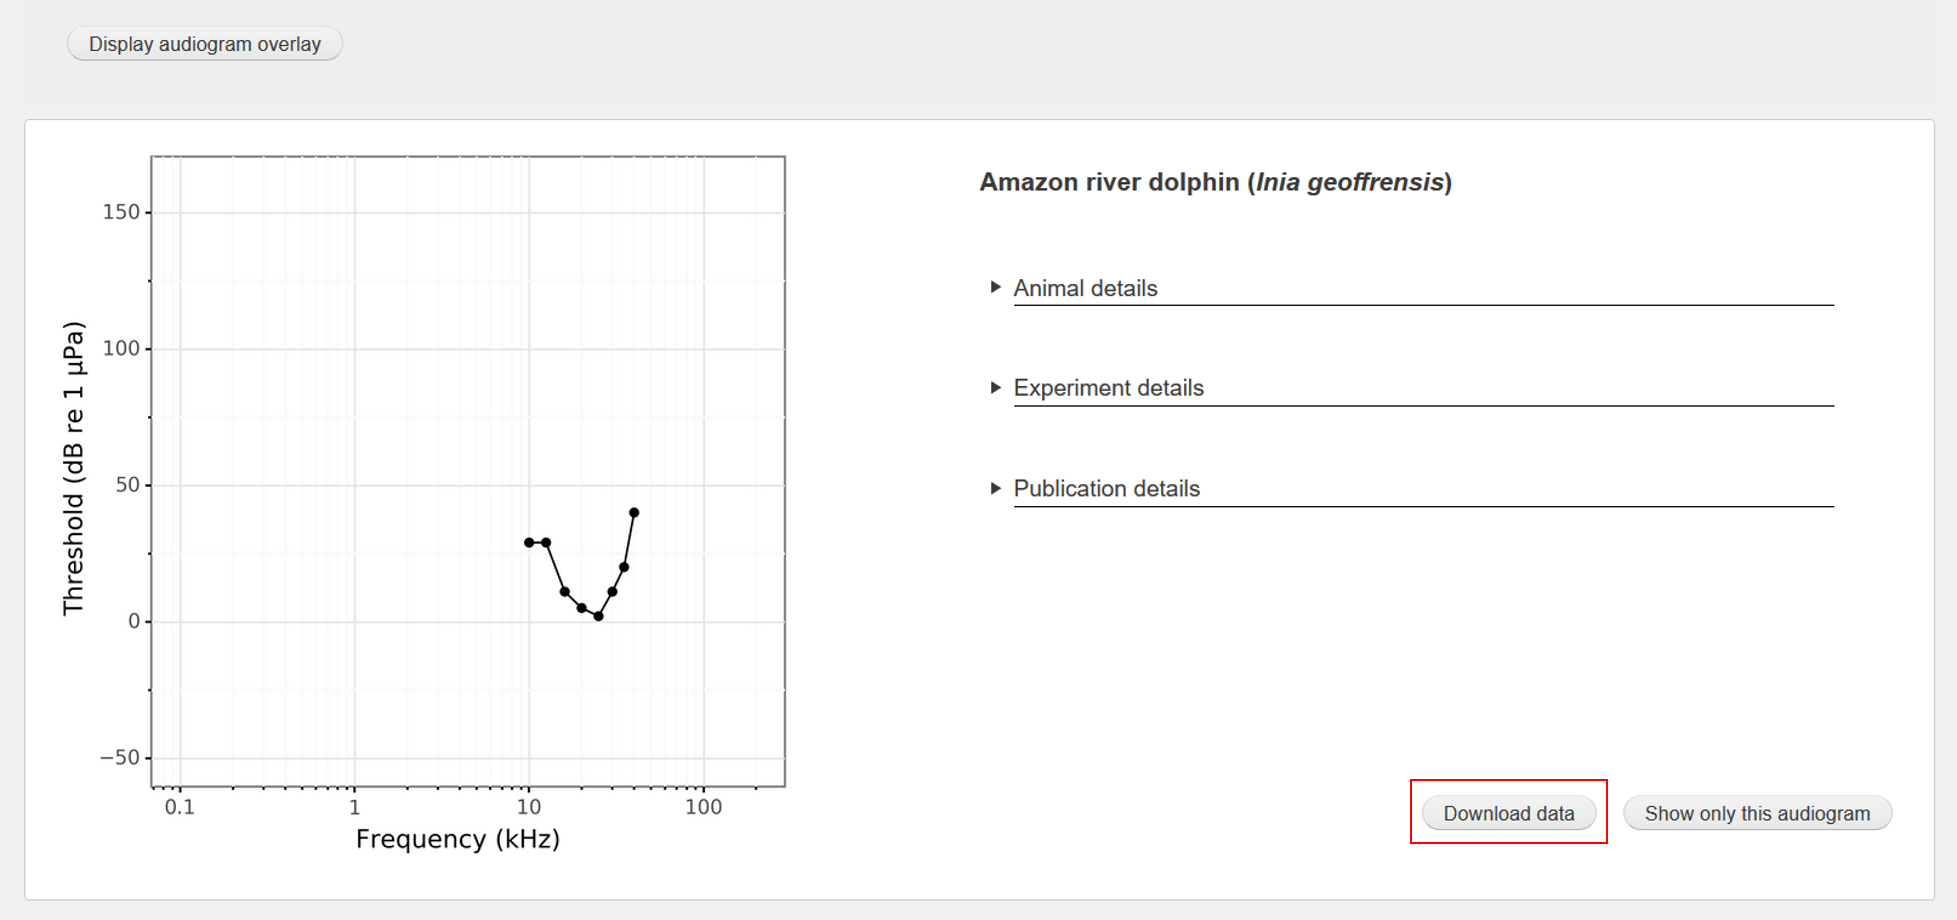
Audiograms and their metadata can be displayed in a detailed view one below the other. Using the function "Show only this audiogram" you can display one audiogram at a time.
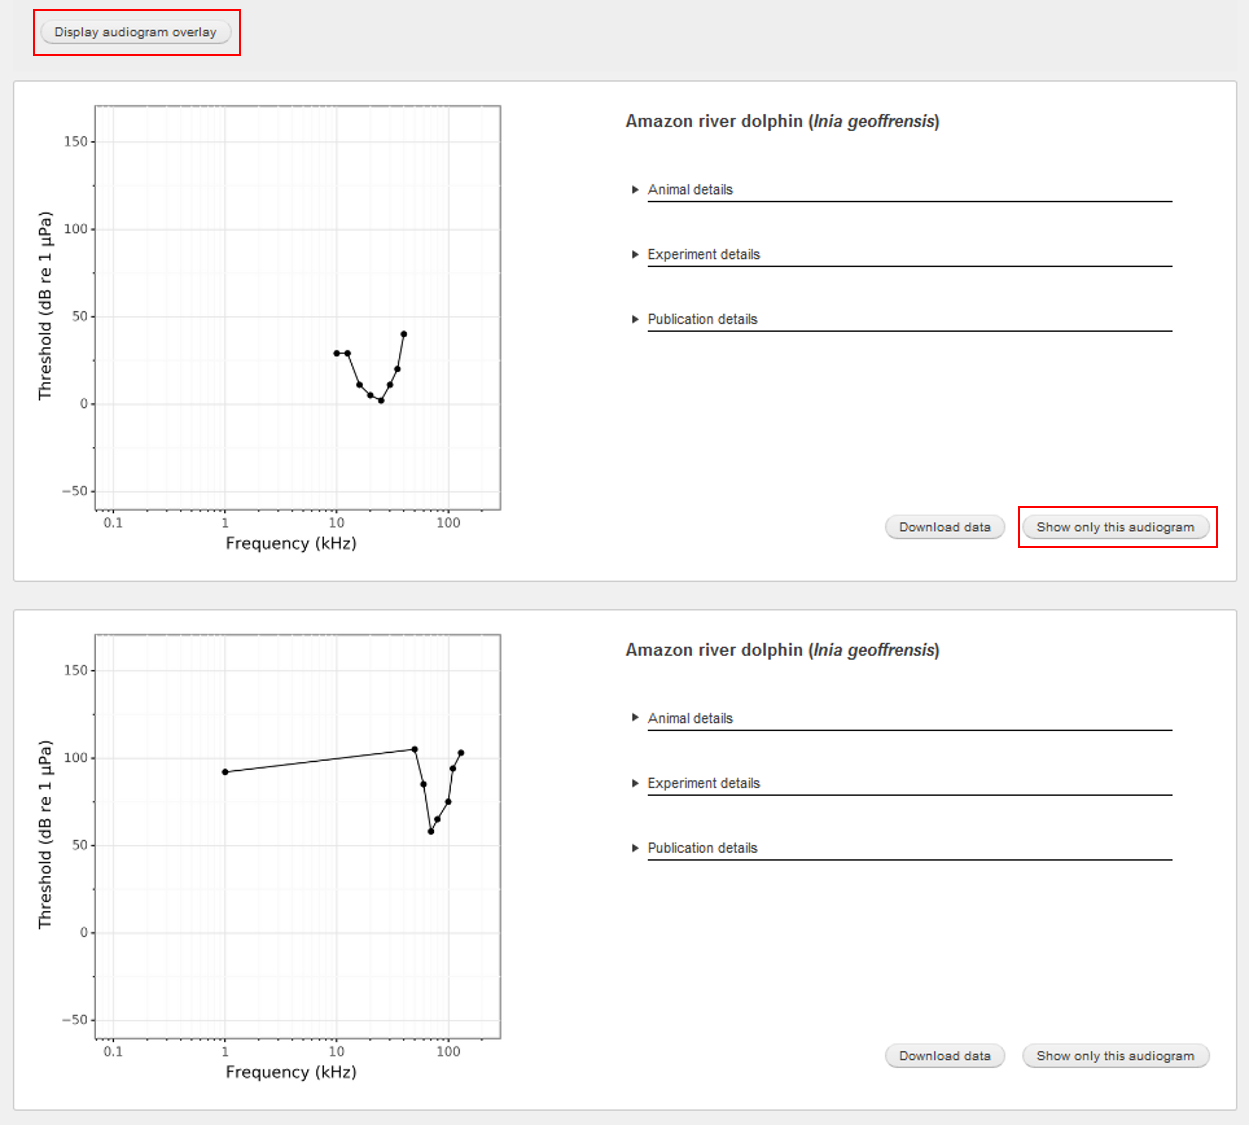
Audiograms containing data from measurements in the same medium - either water or air - can be combined into an overlay audiogram by using the "Display audiogram overlay" function.
The data presented here are the original values from the cited publication, which we have transferred identically. Oboslete SPL reference units have been converted into current reference units for graphical representation.
Attributes
The metadata of a given audiogram comprises the following attributes:
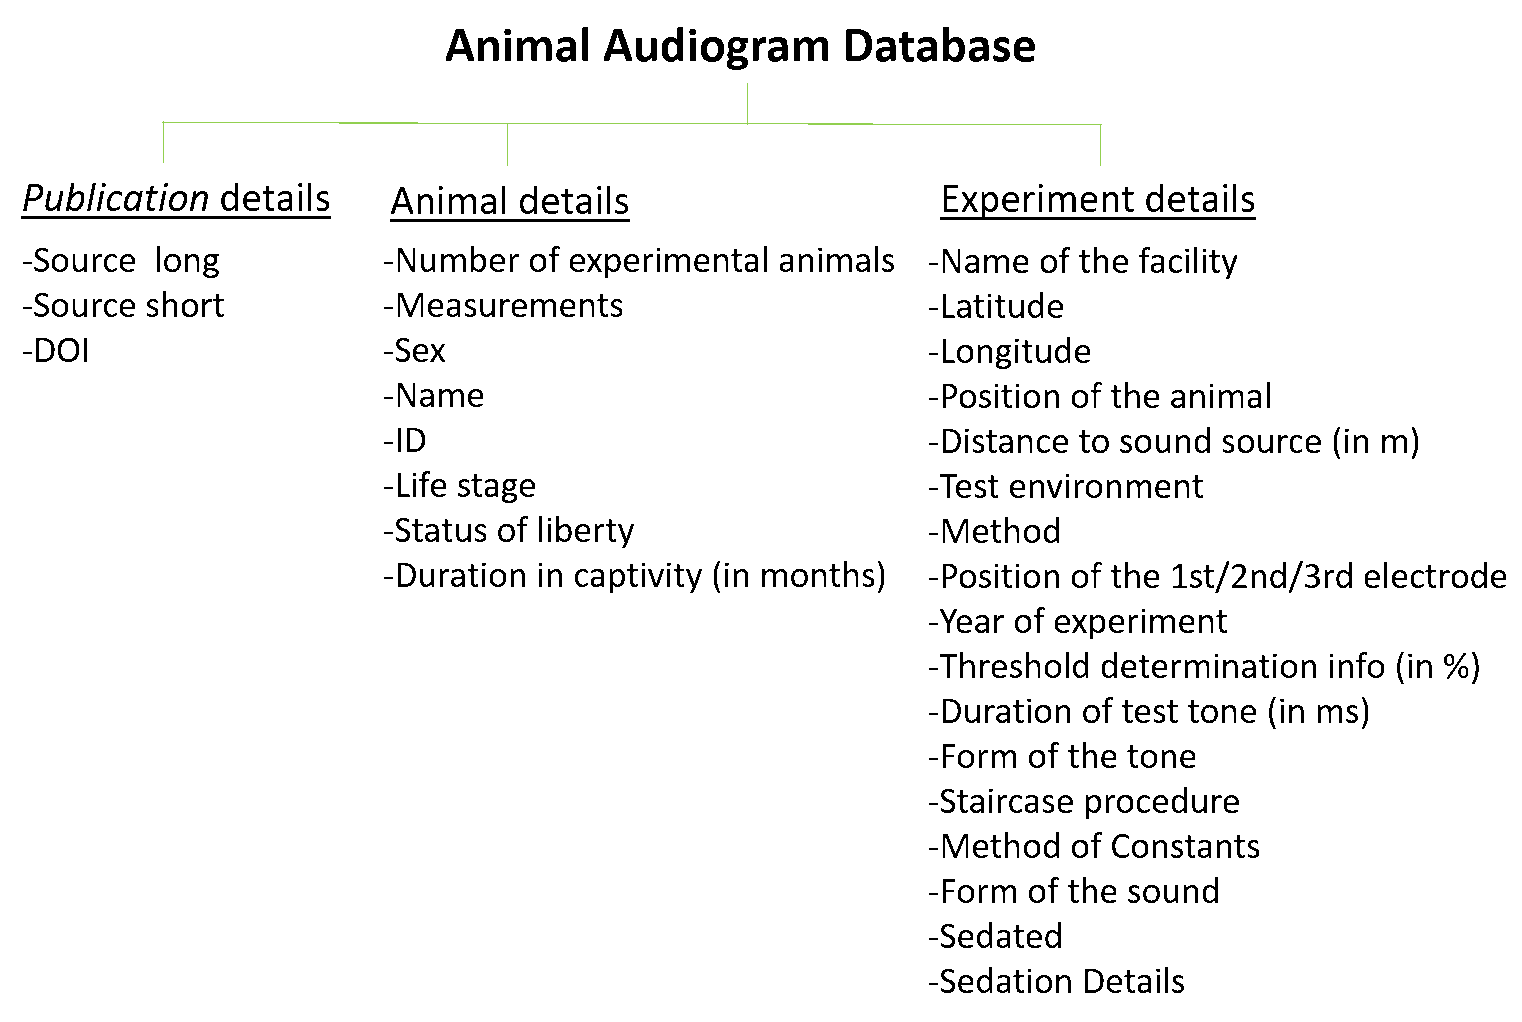
Available information was extracted from the original source into the corresponding data fields. This information is displayed next to the audiogram. When corresponding data is not contained in the original source, the respective data fields are not listed next to the audiograms.
Download and analyse the data
- The data can be downloaded using the "Download data" function
- Examples of data analysis and visualization can be found here
- If you prefer JSON, a public API is available. lease see teh API reference
- Help on importing data into Excel (screenshots in German)